

Has a video with 100,000 views succeeded if nobody clicks, follows or watches it to the end? To judge, you need to separate reach from attention and results. Our article on how to read and interpret social media KPIs helps you set up this framework before comparing posts.
TikTok analytics brings together several levels of insight: the account, each video and sponsored campaigns. These data sets differ in both scope and purpose. The France Num guide lists, among other things, views, average watch time, traffic sources and activity times as useful data for businesses. The point is to understand how they relate to one another, rather than hunting for a single figure.
What Do Account and Video Statistics Measure?
Imagine your account has racked up more views this month, but the new videos are attracting few profile visits. The overall figure shows a trend, but doesn’t identify which content explains it. Account statistics give an overview of a chosen period, such as view volume, follower growth or profile visits.
Video data isolates a single post. It lets you examine its views, interactions, average watch time or traffic sources, where these metrics are available. The difference is practical: the account level is for tracking a trend, while the video level helps you compare content and spot what is worth testing.
Don’t confuse a post’s views with the number of unique people reached. Not all metrics describe the same thing. Also check the selected period and the post type before comparing two results.
Which TikTok Metrics Should You Track for Your Objective?
If your objective is visibility, start with the views and impressions available in the report you are looking at. If you want to hold your audience’s attention, look at watch time and completion rate. To track reactions, examine likes, comments, shares and saves.

Clicks show whether a video or ad drives people to a destination. Conversions measure a defined action, such as a sign-up or a purchase, provided the relevant tracking is set up. A measurement guide from TikTok for Business groups metrics into reach, engagement and conversion. This structure helps you choose measures that match an objective rather than piling up figures.
When analysing an engagement rate, always state how it is calculated: interactions relative to views, reach or another base. Two rates calculated on different denominators are not directly comparable. To dig deeper into metrics specific to video content, see the metrics for measuring social videos.
How Do You Interpret Retention Without Overrating Views?
A video can attract views without holding attention for long. Average watch time gives an indication of how long people spend watching the content, while completion shows the proportion of views that reached the end, if this metric is available.
First compare videos of similar length and format, over equivalent periods. For example, if a 20-second video shows an average watch time of 10 seconds, that average represents half its length. On its own, however, it doesn’t tell you how many people watched to the end.
Next, pinpoint where attention drops and form a specific hypothesis. A rapid drop-off may justify testing the hook or the opening of the edit. If viewers stay until the end but don’t click, look instead at how clear the call to action is or how relevant the destination is.
How Do You Tell Organic Data Apart from Paid Campaigns?
Organic posts tell you about the distribution of and interactions with content published on the account. Ad reports add metrics related to spend, impressions, clicks and results attributed to campaigns. So don’t set an organic video’s views against a campaign metric without checking their definitions.
The selected columns and the scope of the report also matter. The TikTok Ads help page on video insights details metrics such as cost, CPC and CPM, and specifies that view-through conversions are not included in this view. Consult TikTok Ads help to understand this report’s limits before comparing its figures with other tools.
A conversion attributed to TikTok does not necessarily follow the same crediting rule as a conversion attributed elsewhere. To interpret discrepancies between platforms, our resource helps you reconcile TikTok and Meta attribution figures. TikTok Ads benchmarks in France can also provide context for reading a campaign’s costs, without replacing your own account’s results.
What Limitations Should You Keep in Mind with TikTok Analytics?
A single rise or fall is not enough to establish why a video’s performance changed. The topic, format, posting time and source of views can vary from one piece of content to another. Compare several similar posts and set a consistent period before drawing conclusions.
Statistics describe observed results, but don’t prove that a single signal explains distribution. An empirical study published in 2022 identified following, likes and watch rate among the personalisation factors studied on TikTok. It describes a specific research framework, not a universal scale to apply to your posts.
Finally, distinguish measuring content from measuring business results. A video can generate interactions without triggering an immediate conversion. To assess its role, compare clicks and conversions with data from your website or sales tool, using the same periods and the same attribution rules.
How Do You Turn Statistics into Concrete Decisions?
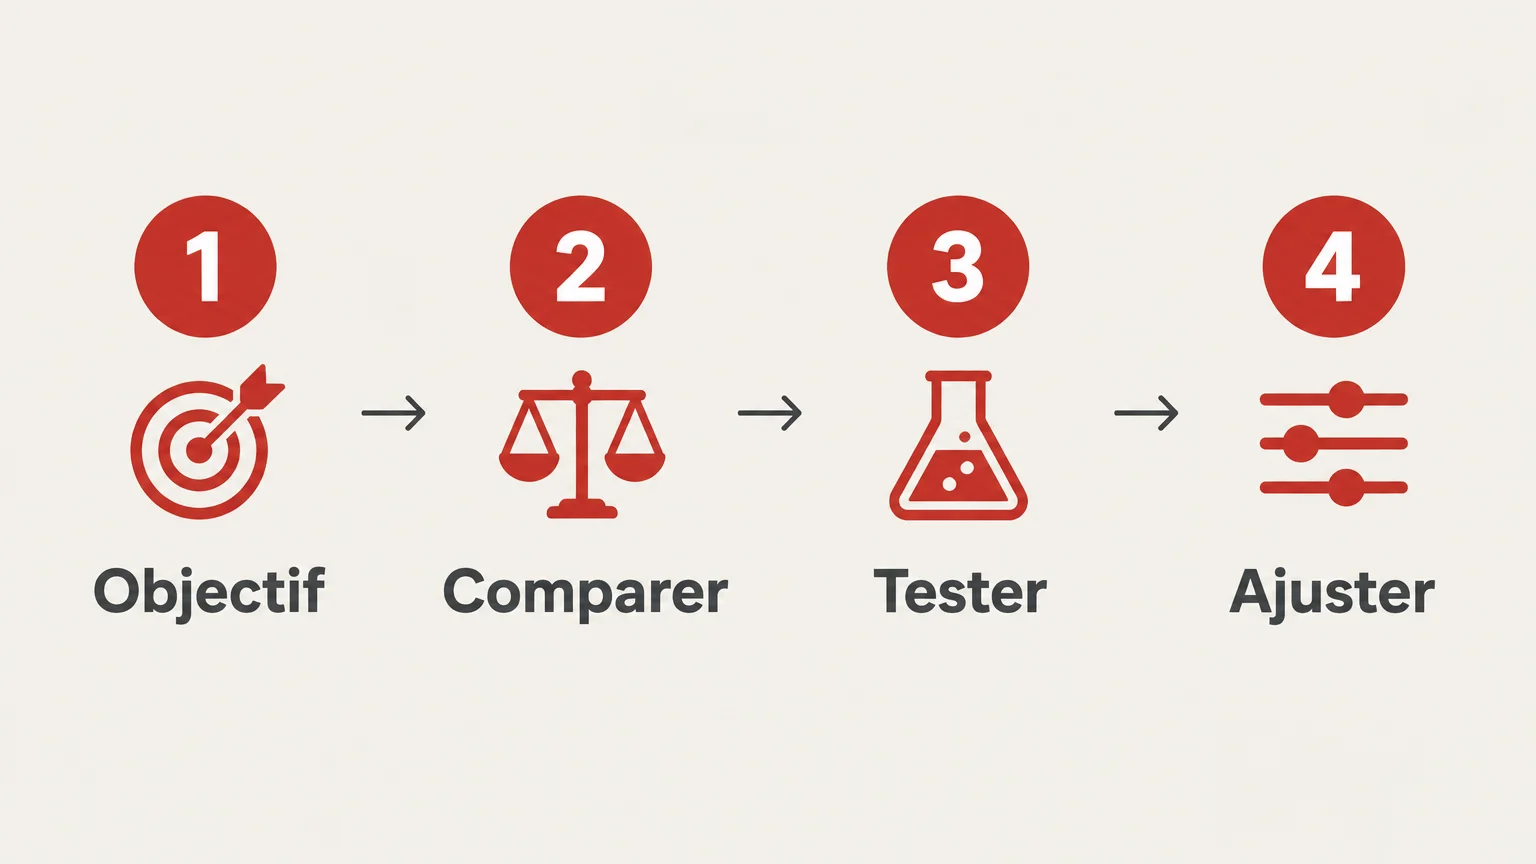
A useful analysis leads to a decision to test. Start by writing down the post’s objective, then choose a primary metric and a control metric. This approach avoids changing several elements at once and losing track of what influenced the result.
- Define the objective, for example increasing visibility, getting clicks or generating sign-ups.
- Choose the metrics that match this objective and note their scope.
- Compare similar content over the same period, then identify a difference to test.
- Change one element, such as the hook or the call to action, and examine the results of the new test.
We have worked with more than 350 brands. Depending on the project, we track views, retention, engagement, clicks and conversions, then analyse the results to test and refine content. This approach links statistics to production decisions, without confusing a video’s results with a sales promise.
Focusing on the Right Metrics to Improve
To make the most of TikTok statistics, start from a clear objective and distinguish account data, video performance and ad results. Compare content with similar characteristics, keep the same measurement scope and turn each observation into a concrete test. It is this continuity between measurement and decision that makes the figures useful.
Link Your Content to Your Objectives
If your statistics are checked without leading to new tests, the issue goes beyond the dashboard. Objectives, scripts, shoots and measurement need to be connected. That is the aim of a set-up that brings organic content, ad creatives and media management together, without confusing production budget with media budget.

We are a vertical video production studio based in Paris and also shoot on location for clients across France. Our team brings together strategy, videographers and editing, with the option of combining production, paid media management or social media management depending on your needs. Discover our TikTok agency to scope support built around your objectives and the available metrics. Services are quoted according to video volume and the level of management chosen.
Frequently Asked Questions
Where Can I Find My TikTok Video Statistics?
Open the analytics tools linked to your account and view the details of the relevant post. The menus and available metrics may vary depending on account type and the features you can access.
What’s the Difference Between Account and Video Statistics?
Account statistics summarise a period and give an overview of how the account is developing. Video statistics isolate a single post to examine its views, interactions and watch time.
Which Metric Should I Prioritise on TikTok?
Choose it according to your objective: views for distribution, retention for attention, clicks for traffic and conversions for a defined action. Keep a control metric to avoid drawing a conclusion from a single figure.
Are Organic and Ad Data Directly Comparable?
No, they don’t always describe the same scope or follow the same attribution rules. Check the definitions, the period and the report used before comparing results.
Can an Agency Help Link Statistics to Content?
Yes. Our TikTok support can combine strategy, video production, paid media management and social media management, depending on your brand’s needs.