

Is a widely viewed post necessarily a high-performing one? Not necessarily: visibility does not tell you whether the people reached watched, interacted or bought. A social media KPI is useful when it answers a concrete question and guides a decision. To link results to spend and sales, you can also measure the ROI of your social media activity.
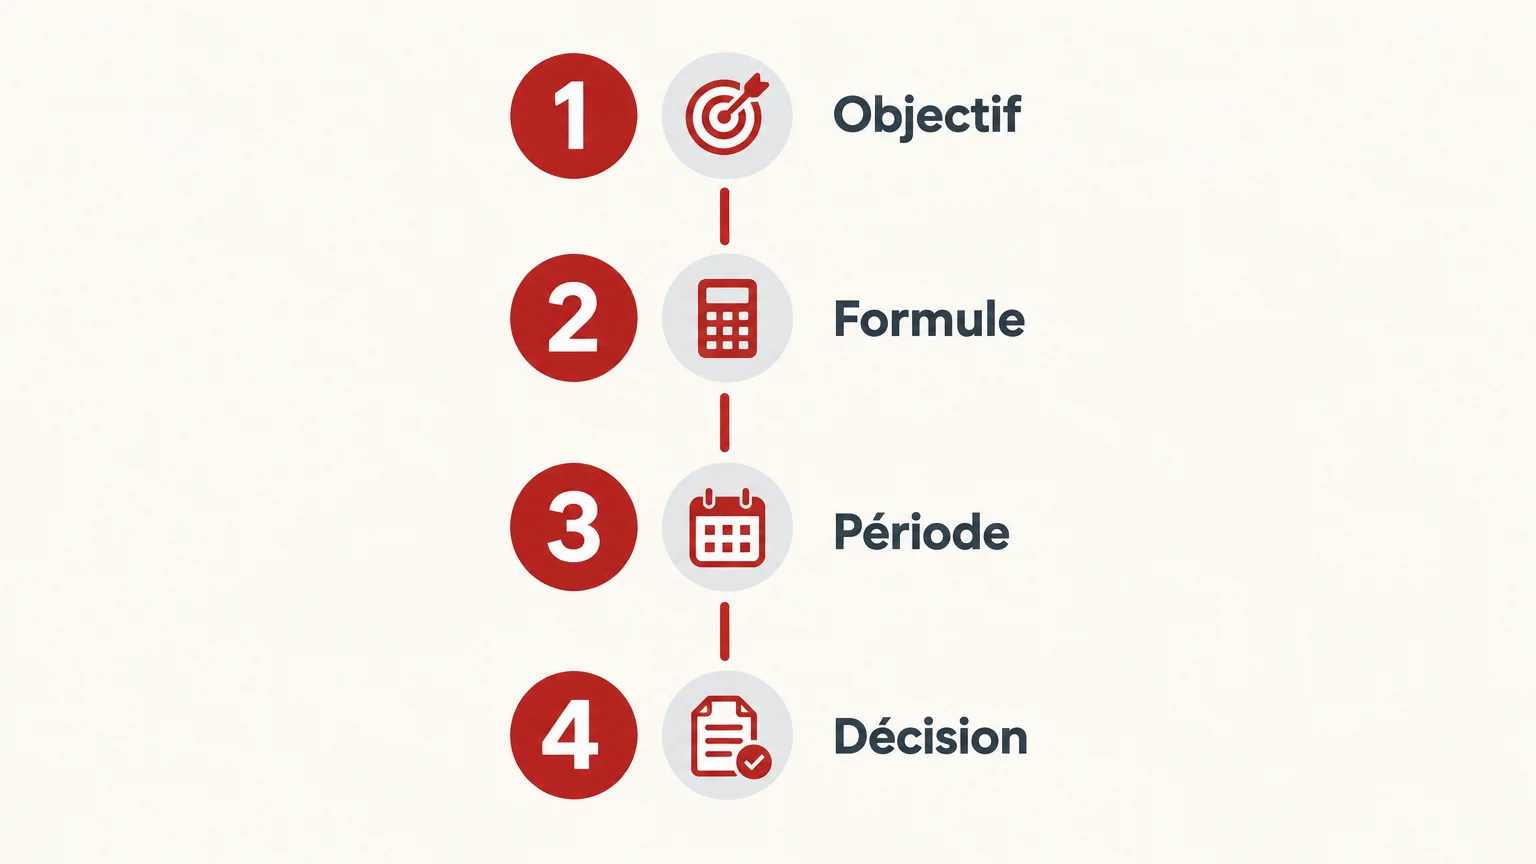
The common trap is comparing figures that do not measure the same thing. Reach, views, engagement rate and conversions depend on how they are defined, the platform and the period chosen. A rigorous reading therefore starts with the goal, then specifies the formula for each metric. You can then tell apart content that grabs attention from activity that genuinely contributes to your results.
Link Each Metric to a Specific Decision
Suppose your goal is to raise awareness among new people. Reach and impressions will be more useful than the number of comments. If you are looking for leads, focus on qualified clicks, completed forms and cost per lead.
A metric becomes a KPI when it is used to assess a defined goal. Start by choosing the intended result, then select one primary metric and a few diagnostic measures. For example, to grow sales from a social campaign, track attributed purchases as the primary result. Add clicks and conversion rate to understand where the journey slows down.
This method avoids confusing activity with effectiveness: posting more or gaining followers does not, on its own, prove that your goal is progressing. Asana's guide also categorises metrics according to awareness, engagement and conversion goals. In your tracking dashboard, record the goal associated with each KPI, its formula, its source and the decision it should inform.
Distinguish Between Reach, Impressions and Views
Imagine the same person sees your post three times. Unique reach will count that person once, whereas total impressions may reflect all three displays. Video views follow yet another definition, which depends in particular on the platform's counting rules.
Rising reach indicates that the content reached more unique accounts according to the measurement used. Impressions growing faster than reach suggests repeated exposure. This can strengthen recall, but it does not yet show that the message was understood or that it prompted any action.
To interpret a change, compare periods of equal length and content in the same format. Also look at the share of your usual audience, if this data is available. An overall increase driven by existing followers does not mean the same thing as growth among new audiences.
Interpret Engagement Using Its Exact Formula

A post can get plenty of likes without prompting a single click or share. The engagement rate summarises interactions, but its result varies depending on which ones you add up and the denominator you choose. A common formula divides interactions by reach; other calculations use followers, impressions or views.
Before comparing two posts, write down the exact formula: which interactions are included, and is the rate calculated by reach or by impressions? Keep the same definition for the content being compared. A rate based on followers answers a different question from a rate based on the people actually reached. To assess creators' contributions, also separate organic and paid results; UGC KPIs call for the same attention to the metrics selected.
The period and changes in methodology matter too. In its Q3 2026 benchmarks, Emplifi states that its Instagram rate is calculated per impression rather than per reach. Its report specifies that this definition means its new results cannot be directly compared with previous reports.
Follow the Journey from Video to Result
For a video, the number of views describes part of the exposure, not the quality of attention. Average watch time shows how long people watch on average. Retention shows the point at which they leave the video, while completion rate tracks those who watch to the end, depending on the data the platform provides.
If views are rising but retention drops at the start, look at the hook, the pacing or the consistency between the promise and the content. If viewers stay until the end without clicking, check the call to action and its relevance instead. To compare formats or concepts, track creative performance by linking attention, interactions and intended actions.
Clicks add another step to the diagnosis. Click-through rate divides clicks by a defined base, often impressions or views. Conversion rate divides completed actions by the visits or clicks used in your calculation. Specify this base and keep it consistent in your reports to avoid misleading comparisons.
Finally, platforms do not always count conversions in the same way. Keep consistent link tracking and cross-check social data against the results from your website or sales tool. If TikTok and Meta figures diverge, reconcile TikTok and Meta attribution figures before drawing any conclusion about each channel's contribution.
Turn Figures into Decisions and ROI
A useful analysis ends with an action to test. If reach increases but clicks stagnate, check the message and the link offered. If clicks rise without conversions, look at the landing page and the consistency of the offer. Note the hypothesis, the change made and the observation period, then compare content run under similar conditions.
To assess social media ROI, divide the profit attributable to social activity by the corresponding investment. Define in advance what you include in costs, such as production and media spend, and the attribution rule used. The resulting figure depends on these choices. ROAS, on the other hand, compares attributed revenue with ad spend, without on its own expressing overall profitability.
Panel results are no substitute for your own data. Metricool's 2026 report compares an average Instagram post reach of 9,877 in 2024 with 6,754 in 2025 across its panel of connected accounts. This change describes that sample, not all accounts. It is a reminder of the value of tracking your own trends rather than treating an industry figure as a universal target.
In practice, a concise report can bring together the goal, the primary KPI, two diagnostic measures, the period, the formula and the next decision. We have worked with more than 350 brands, with no reference period specified for this figure. In our content work, we track views, retention, engagement, clicks and conversions according to the goals, then analyse the results and test different approaches.
Key Takeaways for Reading Your Social KPIs
Social media KPIs become useful when their goal, formula and period are clearly defined. Start with the expected result, check the denominator, then read the metrics together to identify the stage that needs improving. Finally, turn each finding into a concrete test and compare results using a consistent method.
Turning Your Metrics into a Lever for Action
When figures pile up without revealing the next decision, it helps to link performance tracking to your content strategy. The choice of formats, the quality of creatives and campaign management should all serve the same measurement goal.

We bring together strategy, vertical video production and, where needed, media buying or social media management. We analyse views, retention, engagement, clicks and conversions according to your goals, then test different approaches to optimise content. We have worked with more than 350 brands, a figure for which no reference period is specified. To structure your approach with our social media agency, let's talk about your content and your priorities.
Frequently Asked Questions
What is the difference between a metric and a KPI?
A metric measures an activity or a result, such as views or clicks. It becomes a KPI when it is used to assess a specific goal.
Which engagement rate should I track?
Choose a formula suited to your goal and the platform, then keep it consistent in your comparisons. Always specify the interactions included and the denominator used.
Why are reach and impressions different?
Reach estimates the number of unique accounts reached, whereas impressions count displays according to the platform's definition. One person can generate several impressions.
How do you link social media to sales?
Track clicks to your website and conversions using a defined attribution rule. Then compare social results with the data from your website or sales tool.
How can Esekai help with performance measurement?
We can combine vertical video production with analysis of views, retention, engagement, clicks or conversions, depending on your goal. Our support can also include media buying or social media management.