

A UGC video can rack up views without driving any visits, or attract few comments while still converting. The right KPI is therefore not the highest number, but the one that matches the decision you need to make. To link results back to the creative work, we also explain how to measure the performance of video creatives according to their role in the customer journey.
In practice, a campaign is read on three levels: attention, interest and action. Define the expected result, the data source and the analysis period upfront, then keep the same denominator definition when comparing videos. This discipline stops you mistaking a visible metric for proof of profitability, especially as platforms don't all define a view in the same way.
Which Metric Should You Choose for Your Campaign Objective?
An awareness campaign, an engagement campaign and an acquisition campaign don't answer the same question. So choose a primary metric that reflects the result you're after, then two or three diagnostic metrics to understand what influences it.
- Awareness: track reach, impressions or views to find out whether the content is being delivered and discovered.
- Consideration: measure relevant interactions, profile visits or saves to spot signs of interest.
- Action: look at clicks, sign-ups, purchases or quote requests, depending on the intended action.
Avoid judging a video designed to drive sales mainly on its likes. Interactions are still useful for understanding how the audience reacts, but they don't replace measuring the intended action. In its 2024 report, the French Ministry of Culture highlights the lack of aggregated data for reliably comparing influencer marketing with other forms of advertising. The Ministry's report therefore encourages caution when interpreting general comparisons and suggests prioritising your own objectives and benchmarks.
A Viewed Video Isn't Always a Watched Video

To assess attention, distinguish raw views from watch time and video retention. The retention rate shows the share of viewers still watching at a given moment, while completion tells you about those who make it to the end. These measures help you see whether the opening holds attention or whether the content loses its audience along the way.
Platforms may define a view differently. The 2026 guide published by UGC Pocket on measurement notes in particular that a TikTok view doesn't necessarily equal an Instagram view. So compare videos on the same platform, with a comparable placement and a consistent denominator. To interpret the first few seconds, also see hook rate thresholds by platform, then video retention rate denominators and thresholds.
A sharp drop in retention may point to an unclear promise, a slow start or a mismatch between the hook and what follows. It doesn't prove the cause: compare several versions and change only one element at a time. You can then check whether a new hook, a different pace or a quicker demonstration improves retention.
When Do Interactions Signal Genuine Interest?
A video can trigger comments, shares or saves, but these signals don't all mean the same thing. An engagement rate sums up interactions against a chosen base, such as reach or views. Always state this denominator in your reports: two rates calculated differently can't be compared directly.
Look at the nature of the reactions too. A comment asking a question about the product can reveal a barrier to purchase, while a share shows a desire to pass the content on. These clues sometimes explain why a video gets clicks or sales, but they don't replace those results.
To compare creatives, analyse them under similar conditions: same platform, audience, period and level of paid distribution. A video shown to a much larger audience may receive more interactions without having a higher engagement rate. Reading volumes and ratios together avoids confusing popularity with signal quality.
How Do You Link Clicks to Conversions and Costs?
For an acquisition campaign, the click-through rate compares clicks with impressions, according to the definition used. It shows how well the creative and its call to action prompt a visit. Meta Ads video benchmarks can help you put this signal into context, provided you compare compatible placements and objectives.
Once you have the click, examine the conversion rate: it compares completed actions with the visits or clicks measured. Also track cost per result, calculated by dividing spend by the number of attributed results. For a sale, return on ad spend compares attributed revenue with media spend. Specify the attribution window and tracking rules, otherwise results from different videos may not be comparable.
As a limited benchmark, Emplifi reports, in its Q1 2026 analysis, a conversion rate 6.73 times higher for UGC content than for non-UGC content. This aggregated analysis covers thousands of brand accounts in the United States between January and March 2026; the result describes its sample, not guaranteed performance for every campaign. Emplifi's Q1 2026 data can provide context, but your own cost per conversion remains the operational benchmark to follow.
To link each creative to its results, use tagged links, dedicated landing pages or separate codes where relevant. Well-prepared tracking lets you distinguish a video's clicks from the conversions actually attributed to it. If you run the creatives as ads, we can also combine their production with A/B tests and media management, depending on the scope of your project.
How Do You Turn KPIs into Creative Decisions?
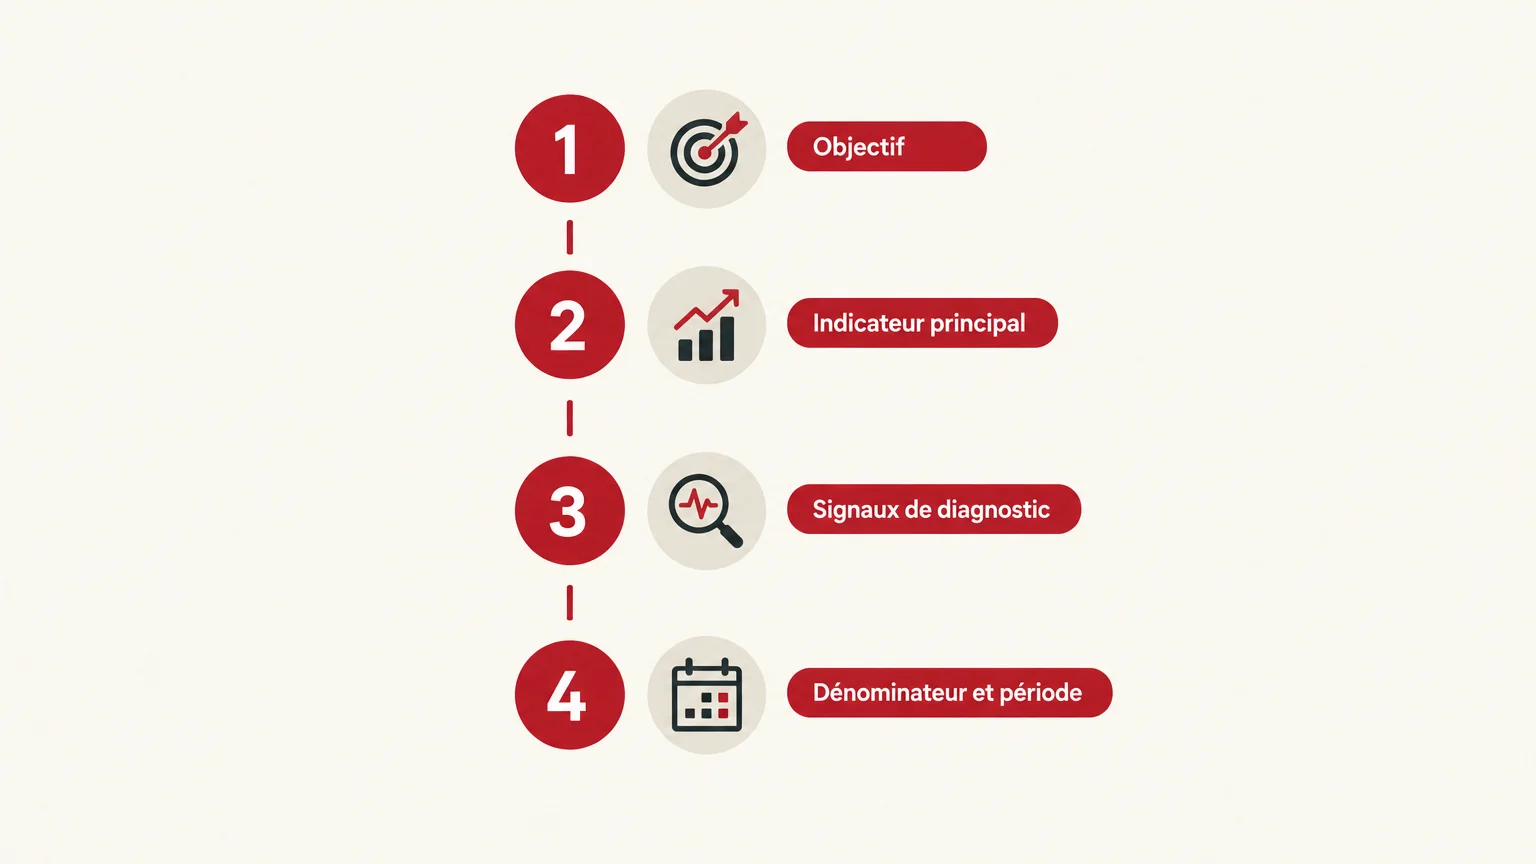
A useful dashboard starts with a decision question: which video should be kept, reworked or tested further? Link each result to a diagnostic signal. For example, good retention followed by few clicks may point the analysis towards the clarity of the offer or the call to action, rather than the start of the video.
- Before launch, write down the objective, the primary KPI, the diagnostic metrics and their denominator.
- After launch, check the platform data against the data from your website or tracking tool.
- Compare creatives over the same period and under similar delivery conditions.
- Decide on one specific change, then check its effect in the next test.
Avoid picking, after the fact, whichever metric gives the most flattering result. To make measurement a production tool, we track views, retention, engagement, clicks and conversions depending on the objectives. We can then test different creative or media approaches without confusing diagnostic signals with the final result.
Key Takeaways for Measuring a UGC Campaign
UGC KPIs make sense when they answer a specific objective. Choose a primary metric, add a few measures that explain the result, then compare videos using the same definitions, periods and attribution rules. Views and interactions describe attention and interest; conversions and costs shed light on action. Used together, these metrics guide your next tests without turning a single figure into a verdict.
Turn Your KPIs into a Creative Action Plan
Measuring a campaign is only worthwhile if the results help you decide what to produce or test next. A shared reading of creatives and metrics lets you link scripting, shooting and distribution choices to your brand's objectives.

We support brands from strategy through to UGC video production, and can then combine the creatives with media management and testing. We have worked with more than 350 brands, and we analyse results against the chosen objectives, from views to conversions. To discuss your content and needs, discover our UGC agency.
Frequently Asked Questions
What are the most useful KPIs for a UGC campaign?
They depend on the objective: reach and views for awareness, retention and interactions for interest, clicks and conversions for action. Choose one primary metric and a few diagnostic measures.
How do you calculate the engagement rate of a UGC video?
Divide the interactions you count by the chosen base, such as reach or views, then express the result as a percentage. Keep the same formula when comparing content.
Should you track views or retention?
Views show playback volume according to the platform's definition, while retention tells you how long the audience keeps watching. Tracking both helps distinguish delivery from sustained attention.
How can you tell if a UGC campaign is driving sales?
Track clicks and then attributed purchases using tagged links, dedicated pages or other suitable tracking methods. Also define the attribution window before comparing results.
How can an agency help measure UGC performance?
We can link video production to its analysis, then test creative or media variants depending on the campaign objective. Tracking focuses on the metrics relevant to your project, not on a single figure.