

Hook rate is the share of a video ad's impressions that reach the initial viewing threshold: 3 seconds on Meta, 2 seconds on TikTok. Formula: views at threshold ÷ impressions × 100. On Meta, the median observed in 2025-2026 sits around 21-24%, the working range between 14% and 30%, the top 10% above 45%. Below 15% on a cold audience, you cut. TikTok thresholds, measured at 2 seconds, cannot be compared with Meta's. And no figure is worth anything below 8,000 impressions. According to Médiamétrie's L'Année Internet 2025, 15-24 year-olds spend 61% of their browsing time on social networks and messaging apps, and even 63% for 11-14 year-olds.
Hook rate: what is the exact definition, and which numbers is it made of?
Hook rate, or attention rate, divides the number of views reaching the platform's initial threshold by the number of impressions served, and multiplies by 100. Two numbers, one quotient. The whole difficulty lies in the fact that these two numbers change definition depending on the platform, the placement, and sometimes the column you chose in the interface.
On Meta, the numerator is called 3-second video plays. The denominator is impressions. On TikTok, the numerator is called Video Views at 2 Seconds. Same denominator, different threshold. Neither Meta nor TikTok serves you this ratio ready-made: according to Hawky.ai (2025), you have to create a custom metric in Ads Manager to get the column. Until you have done so, you are looking at something else. The TikTok Ads help centre defines 2-second video views as the number of times your video is played for at least 2 seconds in an impression session, not counting replays.
The four names of the same calculation
In conversations with media teams, the same ratio goes around under four labels: hook rate, thumbstop ratio (or thumbstop rate), 3-second VTR, and sometimes simply “attention rate”. They all point to the same quotient. The trap comes when a provider announces a thumbstop rate of 38%: ask for its denominator before being impressed. Some third-party tools divide by views and not by impressions, which mechanically inflates the figure. The detail of the problem is covered in our article on the detail of denominators and calculation trapswe do not unpack it again here.
An impression is not a video that has started
A point almost nobody mentions: according to Starti.ai (analysis published in early 2026), outside Audience Network, Meta counts an impression whether or not the video has started. Direct consequence: your hook rate also measures loading speed, the connection quality of the audience served, and scroll behaviour on the placement. It is not a purely creative indicator. It is a creative indicator contaminated by delivery. We will draw the consequences in the H2 on false culprits.
Why can a TikTok hook rate never be compared with a Meta hook rate?
Because TikTok counts at 2 seconds and Meta at 3 seconds: a TikTok hook rate is mechanically higher, without any creative being better. TikTok does not expose a 3-second milestone; its viewing milestones start at 2 and then 6 seconds (Designerbox, January 2026). Comparing the two raw figures is comparing a 100-metre sprint with a 110-metre hurdles race.
On our campaigns, when the same creative runs on both ad platforms with comparable cold audiences, the systematic gap favours TikTok by around 6 to 10 points. An internal order of magnitude, not an official conversion table: no platform publishes one, and the missing second cannot be corrected with a clean rule of three. The only usable rule: a hook rate is only compared with another hook rate measured at the same threshold, on the same placement, over the same date window.
YouTube is out of the game. On skippable formats, the user cannot skip before the 5th second; the relevant metric becomes the 30-second View Rate (or full view), not the hook rate (Imagine.art, late 2025). Calculating a hook rate on YouTube amounts to measuring a door that does not open. Shorts are an intermediate case: scrolling exists, but the data exposed on the Ads side does not give you a 2 or 3-second milestone that can be used the same way.
A hook rate threshold without its counter (2 s or 3 s), its denominator (impressions or views) and its measurement date is not data. It is a rumour with a number on it.
What are the real hook rate thresholds in 2026, by platform and placement?
No platform publishes an official hook rate benchmark: every figure in circulation is an aggregate from third-party tools, and they converge around a 20-25% median on Meta. Billo, in its Video Ad Hook Rate Benchmarks 2025, measures a global average of 24.42% across more than 80,000 sales-campaign video ads, spread over 14 sectors. Biddyco, in Hook Rate and Hold Rate on Meta: 2026 Benchmarks, works on 479 Meta videos and $10.1M of real spend: median at 20.9%, middle half between 14% and 30%, top 10% above 45%.
The gap between the two sources is not a contradiction: Billo publishes an average, Biddyco a spend-weighted median. The median is the right reference for decisions; the average is pulled upwards by a handful of creatives at 60%.
| Platform / placement | Exact metric | Cut | Working zone | Scale zone | Minimum impressions |
|---|---|---|---|---|---|
| Meta, Reels 9:16, cold | 3-second video plays ÷ impressions | < 15% | 15 – 30 % | > 32% | 8 000 |
| Meta, Feed 4:5, cold | 3-second video plays ÷ impressions | < 12% | 12 – 25 % | > 28% | 8 000 |
| Meta, Stories | 3-second video plays ÷ impressions | < 12% | 12 – 22 % | > 26% | 10 000 |
| Meta, retargeting | 3-second video plays ÷ impressions | < 20% | 20 – 35 % | > 40% | 5 000 |
| TikTok, In-Feed Ads | Video Views at 2 Seconds ÷ impressions | < 18% | 18 – 32 % | > 40% | 10 000 |
| TikTok, Spark Ads | Video Views at 2 Seconds ÷ impressions | < 22% | 22 – 38 % | > 45% | 10 000 |
| YouTube Shorts / skippable | View Rate (30 s), no hook rate | not applicable | not applicable | not applicable | , |
| TikTok organic | Views ≥ 2 s ÷ total views (different denominator) | < 45% | 45 – 65 % | > 70% | 15,000 views |
Where these figures come from, line by line. Meta Reels and TikTok In-Feed use the grid published by Coinis (Hook Rate glossary, 2026: Reels 9:16, under 15% weak, 20-25% average, 30%+ strong; TikTok in-feed, under 18% weak, 25-32% average, 40%+ strong), cross-checked against the Biddyco quartiles. Benly (2026) gives consistent “good” ranges: Meta 25-35%, TikTok 30-45%, YouTube 20-30%. The Feed 4:5, Stories, retargeting and TikTok organic lines are our internal benchmarks, calibrated on French e-commerce accounts that we have managed since 2024. They are published nowhere else and we own them as such.
The sector shifts the grid by several points. Billo measures Health & Beauty at around 28% and Services at around 20%. A hook rate of 22% is mediocre for a serum, respectable for B2B software. Before using the table, shift it by the sector gap.

From how many impressions does your hook rate mean anything?
Below 1,000 impressions, a hook rate supports no decision; to separate two creatives 2 points apart, you need roughly 8,000 to 10,000 per creative. This is the black hole of every benchmark article: they publish averages, never the volume below which the figure is noise.
The calculation is simple and verifiable. On a proportion around 20%, the 95% margin of error is about 1.96 × √(0.2 × 0.8 / n). Which gives: As the definition of the confidence interval published by Insee reminds us, a 95% confidence interval has a 95% chance of containing the value that an exhaustive measurement would have given.
- 500 impressions → ± 3.5 points. Two creatives at 19% and 23% are statistically identical.
- 1,000 impressions → ± 2.5 points. You can rule out a hopeless case (gap above 10 points), nothing else.
- 3,000 impressions → ± 1.4 points. You can settle a 5-point gap.
- 8,000 impressions → ± 0.9 points. You can settle a gap of 2 to 3 points.
- 20,000 impressions → ± 0.6 points. Beyond that, you are paying for precision you will do nothing with.
Translated into budget: at a CPM of €10, 8,000 impressions cost €80 of media per creative. A test of six hook variants therefore requires about €500 for the reading to stand up. That is the real entry ticket for a hook test, and it is why tests at €20 per creative only produce opinions.
A field rule we have applied since 2025: we never cut on hook rate before 48 hours AND 8,000 impressions, both conditions together. A creative's first day is polluted by the learning phase and by still-broad targeting. We cut too many creatives after 6 hours in 2023-2024 to keep doing it.
Low hook rate: is it really the hook? The five false culprits
A hook rate under the threshold points to the first second of the video only one time in two: the other causes are in the targeting, the placement, the ratio, the offer or the technical first frame. Before relaunching a shoot, go through the list. It takes ten minutes and saves €2,000 of pointless production.
1. The mixed placement
If your Advantage+ placements mix Reels, Feed, Stories and Audience Network, your hook rate is an average of four different scroll behaviours. Segment by placement before judging. On our accounts, the Reels / Audience Network gap on the same creative regularly exceeds 15 points.
2. The ratio that does not match the placement
A 4:5 cropped to 9:16 loses the top or bottom of the image, often the face or the product. The viewer sees a strip. The hook rate collapses without the hook being at fault.
3. The static or black first frame
Fade-in opening, fixed shot of a packshot, logo: these are three ways to lose 5 to 8 points. Coinis points out, citing Meta's Reels for Business hub, that the best-performing Reels Ads place their hook in the first second and a half. Movement must start at frame 1, not at frame 30.
4. Ad fatigue mistaken for a bad hook
A creative that started at 28% and falls to 17% in three weeks does not have a bad hook: it has been seen. The decay curve and the alert thresholds are detailed in our article on how to tell a weak hook from ad fatigue. The test that settles it: relaunch the same creative on an audience excluded from the previous exposure.
5. The off-topic offer for the audience served
A brilliant hook on a product that does not concern the person does not hold them. If the hook rate is low across all your creatives, all your hooks, all your weeks, the problem is no longer production. It is upstream.
When the list has been run and the culprit really is the hook, you go back to writing: the 3-layer method for rewriting the hook gives the visual, sound and text structure to rebuild. You do not change everything: you change the layer that is missing.
High hook rate but zero sales: what should you look at next?
A high hook rate predicts nothing on its own: according to Biddyco (2026), the median Meta hold rate is 4.6% (ThruPlays ÷ impressions), meaning roughly one 3-second play in five goes all the way to the ThruPlay (15 s or full video), middle half 3–7%. The hook opens the door. It does not sell.
The hold rate suffers from the same vagueness as the hook rate. Adlibrary (mid-2025) points out that Ads Manager does not display a hold rate: it is built either as ThruPlays ÷ impressions, or as ThruPlays ÷ 3-second plays depending on the team. Two formulas, two orders of magnitude. Fix yours in writing and never change it, otherwise your comparisons from January to March mean nothing.
The useful reading uses three metrics, never one. Here is what each combination points to.
| Combination | Probable cause | Production action | Timeframe |
|---|---|---|---|
| Hook high / hold high / CTR high | Healthy creative, the problem is downstream (product page, price, stock) | Spin the angle into 5 to 8 variants, leave the hook untouched | 7 days |
| Hook high / hold low | Clickbait opening, promise not kept between the 3rd and 8th second | Rewrite block 2 of the script, keep the opening as is | 3 to 5 days |
| Hook low / hold high | Good content badly opened, the few who stay are highly qualified | Re-edit 3 new openings from the same rushes, zero reshoots | 48 h |
| Hook low / hold low | Off-topic angle for the audience, not an execution problem | Cut, change creative angle, reshoot | 10 to 14 days |
The “hook high / hold low” case is the most frequent among brands that have read too many articles about scroll-stoppers. You build a spectacular opening that has nothing to do with the product, the figure goes up, sales don't move. Hook rate then becomes a vanity metric. For the rest of the funnel, our three click ratios to measure on Meta Ads video complete the picture.
One last element, and it carries real weight in 2026: according to Adlibrary, Meta's Andromeda ranking system relies heavily on early retention signals to choose which creatives to deliver widely. A creative with a mediocre hook rate never receives enough budget to prove it converts. You do not scale against the algorithm. In the technical article published by Engineering at Meta in December 2024, Meta states that rolling out Andromeda on Instagram and Facebook improved the recall of its ad selection system by 6%.
How much does one point of hook rate cost?
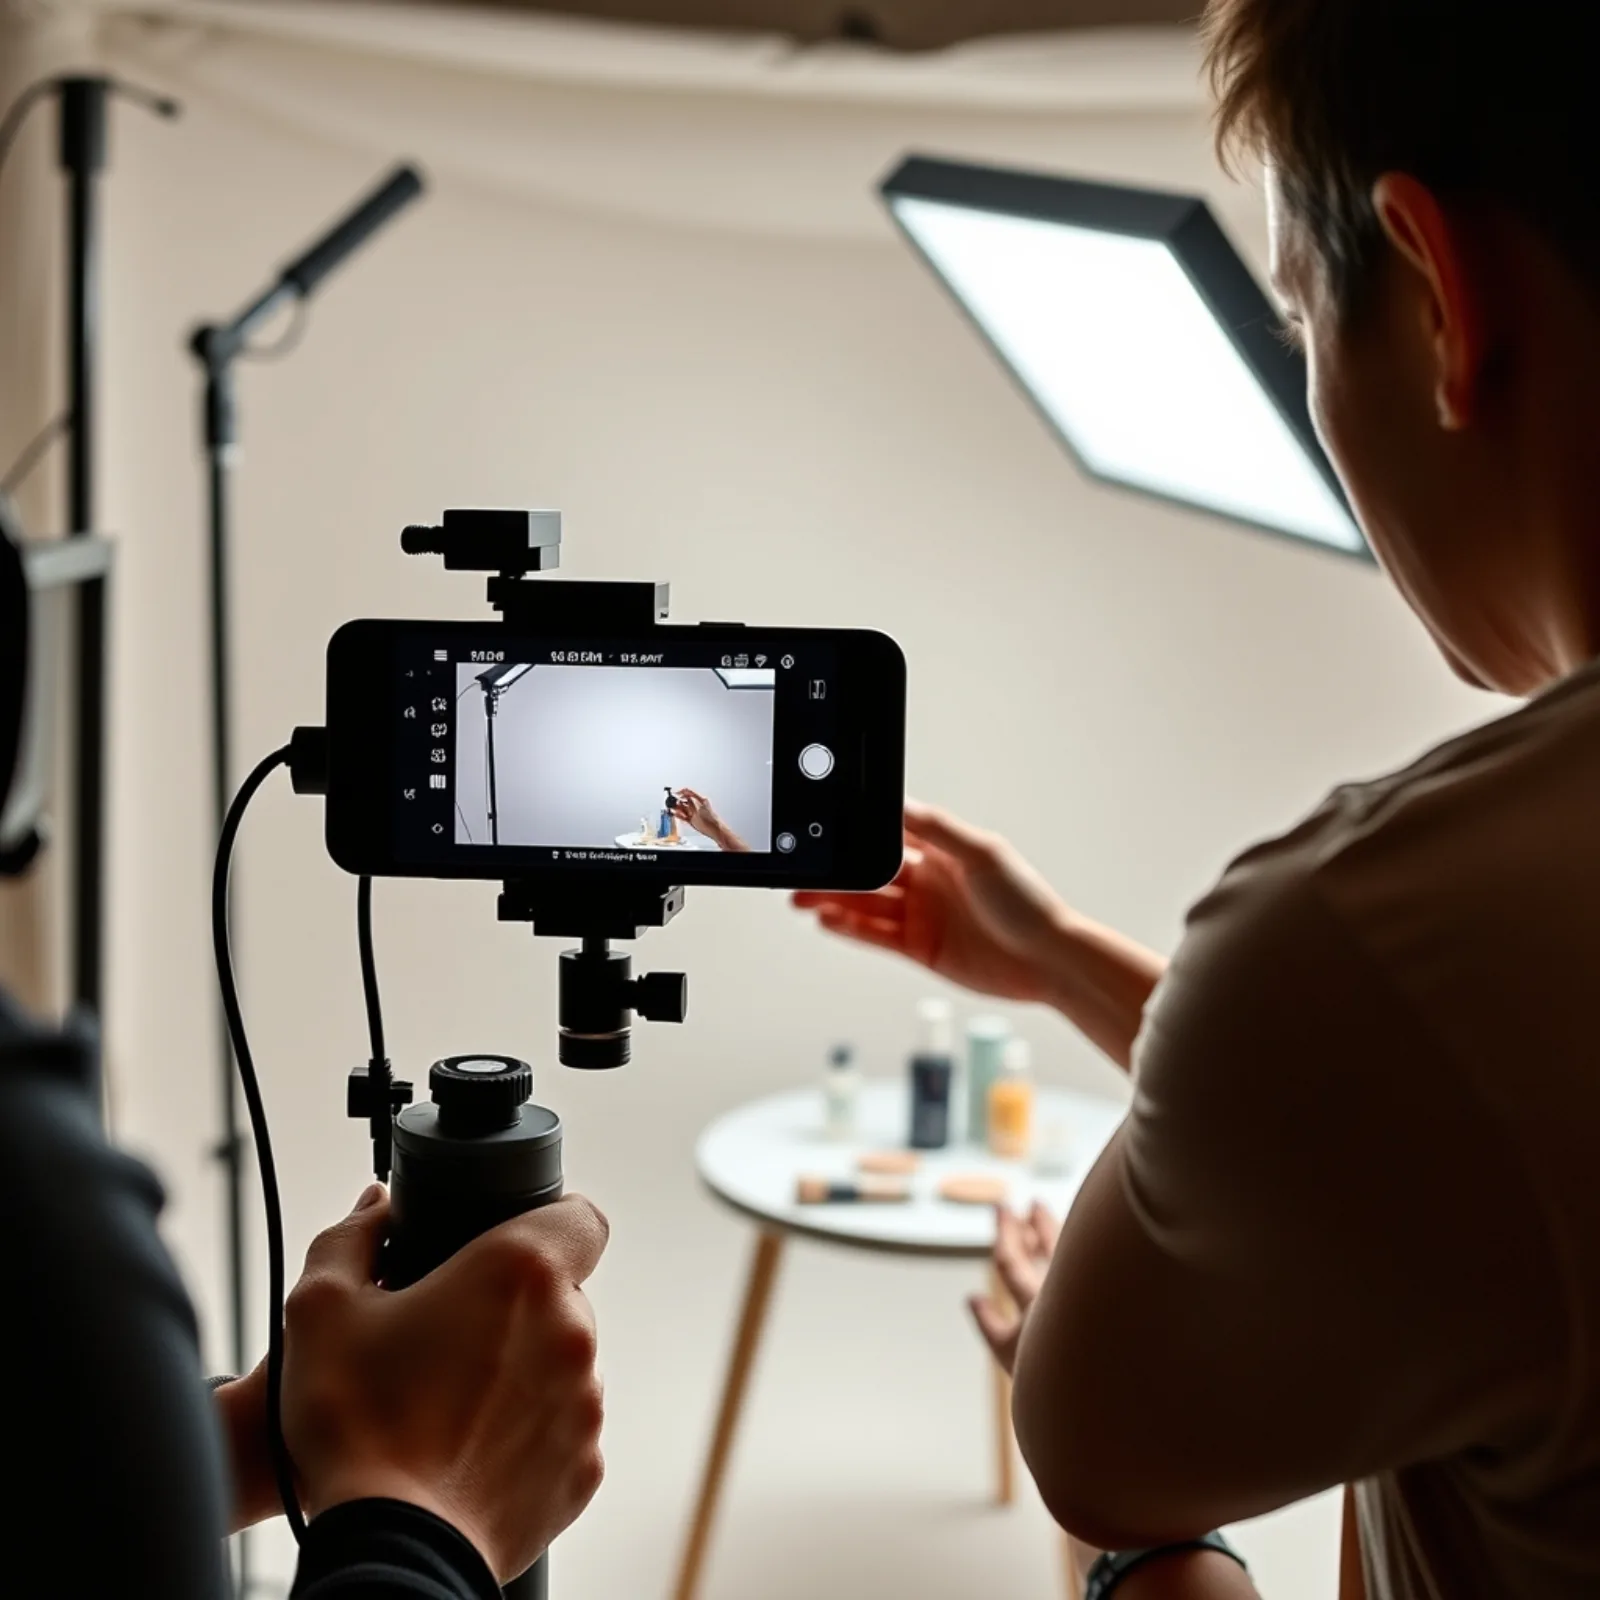
On our 2025-2026 productions, an opening variant shot on an existing setup costs €60 to €150; taking a creative from 18% to 26% takes six variants on average, or about €60 to €110 per hook rate point. This calculation is our own, built on our own cost-per-creative grid, not on a published study. It applies to French vertical video, with a creator already cast and a rush already shot.
The formula: cost per point = (cost of one variant × number of variants tested) ÷ hook rate gap achieved. Six variants at €90 = €540, for 8 points gained, gives €67.50 per point.
What these €540 buy on the media side
Take a monthly budget of €10,000 at a CPM of €12: 833,000 impressions. At an 18% hook rate, you buy 150,000 3-second views. At 26%, you buy 216,600. That is 66,600 additional views for €540 of production, or €8.10 per thousand 3-second views. The same 66,600 views bought in media at the initial hook rate would have cost €66.70 per thousand. A ratio of 1 to 8.
That is the only honest argument in favour of production: above a certain media threshold, reshooting openings is eight times cheaper than buying the same attention. Below €3,000 of monthly media, this calculation reverses: six variants at €540 represent 18% of your budget and you will not even have the 8,000 impressions per variant needed to separate them. Small budgets test three openings, not six. The full reasoning on the number of variations is in the rule of 3, then 5 to 8 variants.
What we cannot quantify
Hook rate gains do not convert linearly into revenue, and nobody knows how to express it cleanly. On some accounts, +8 hook points cut CPA by 20%; on others, CPA did not move because the extra traffic was less qualified. We have no coefficient to give you. What we consistently observe is the effect on distribution: a creative with a high hook rate receives more budget from the algorithm, and therefore more chances of finding its buyers.
Which thresholds should you apply in organic, where the paid grid breaks down?
In organic, the denominator is no longer the impression but the view: the thresholds published for paid are unusable and you should aim for 45% minimum, not 15%. TikTok Analytics and Instagram Insights reason in views, that is, videos actually started. Mechanically, the ratio starts much higher.
On the organic accounts we manage, a TikTok video that keeps fewer than 45% of its viewers at 2 seconds never leaves its first distribution pocket. Above 65-70%, it receives a second wave. These are our observations on French beauty, food and retail accounts between 2024 and 2026, not data published by TikTok.
Second difference, often ignored: in organic, part of the traffic comes from your own community, which recognises you and stays. An account with 40,000 engaged followers shows higher attention rates than a new account, at identical creative quality. Comparing your organic hook rate with that of a more established competitor leads nowhere. Compare yourself with yourself, week after week, on the same format.
And if you reuse a top organic post as Spark Ads, expect to see the figure drop by 20 to 30 points overnight. Nothing changed in the video. The denominator did.
What should you do with these thresholds next week?
Fix your counter, your denominator and your minimum volume once and for all, then stop debating the figures and start producing openings. Billo measures an average that stayed between 23.81% and 24.70% across the whole of the second half of 2025: the market did not move by more than a point in six months. If your hook rate has dropped, the explanation is not in the market. It is in your last batch of creatives, or in your targeting.
Hook rate remains a stage indicator, not a verdict. It measures the opening and nothing else. To put it back in its place in the full measurement chain, go back to our article on the 4-stage creative measurement protocolhook rate occupies stage 1 there, and only stage 1.
One position to finish, which does not suit us commercially: if you spend less than €3,000 a month on media, do not build a hook rate measurement system. You will never have the impression volume to decide. Shoot four creatives, let them run for three weeks, look at the sales. The rest is astrology to two decimal places.
Frequently asked questions
- What is the exact formula for hook rate?
- Hook rate = views reaching the initial threshold ÷ impressions × 100. On Meta, the numerator is the “3-second video plays” column; on TikTok, “Video Views at 2 Seconds”. Neither ad platform displays this ratio by default: you have to create a custom metric in the interface, otherwise you are reading a different statistic.
- What is a good hook rate on Meta in 2026?
- According to Biddyco, across 479 Meta videos and $10.1M of spend, the median is 20.9%, the middle half between 14% and 30%, and the top 10% above 45%. On a cold audience in Reels 9:16, we consider that below 15% the creative gets cut, and that above 32% it deserves budget.
- Why is my TikTok hook rate always higher than on Meta?
- TikTok counts a view at 2 seconds, Meta at 3 seconds. The one-second difference is enough to produce a structural gap: on our campaigns, the gap runs from 6 to 10 points at identical creative quality. No official conversion table exists between the two thresholds, so the figures must never be compared directly.
- How many impressions do you need before cutting a creative on its hook rate?
- Allow 8,000 impressions per creative to settle a gap of 2 to 3 points, 3,000 for a 5-point gap, 1,000 at the very minimum to rule out a hopeless case. Below 1,000 impressions, the statistical margin of error exceeds 2.5 points and any decision comes down to chance.
- Hook rate and hold rate: what is the difference?
- Hook rate measures the opening (3 seconds on Meta), hold rate measures what follows. Be careful with the definition: Ads Manager calculates hold rate as 75% plays ÷ 3-second plays, whereas most performance teams use 15-second plays ÷ 3-second plays. The median Meta hold rate is around 4.6% according to Biddyco.
- Can you use the same hook rate thresholds in organic?
- No. In organic, the denominator is the number of views, not impressions, which makes the ratio start much higher. On the TikTok accounts we manage, the useful floor is around 45% and the strong distribution zone is above 70%. Applying a paid grid to organic leads you to validate mediocre videos.
Do your hooks meet the threshold grid?
You now know where to set your cut and scale thresholds. What remains is producing the openings that clear them. Esekai is a vertical video studio: creative ads, UGC and organic content for TikTok, Reels and Shorts, with a dedicated Creative Strategist, in-house shooting and editing, and iterations delivered within days. Thirty minutes on the phone: formats, budget, action plan. No agency pitch deck.
Book a call →30 minutes to talk formats, budget and action plan.