

An ad can rack up views without bringing the brand any closer to its goal. When analysing a video ad, the right question is therefore not just “how many people watched it?”, but “where does attention drop off, and what action follows?”. This reading connects scripting and editing choices to results, and builds on our method to measure the performance of an ad creative.
The same creative can grab attention yet fail to prompt clicks. To understand this gap, separate three dimensions: the video’s content, its delivery conditions and the campaign result. That way, you avoid automatically attributing to the creative a result that also depends on targeting, placement or the offer.
What Was the Video Meant to Achieve?
Before opening the dashboard, ask yourself what action the campaign was supposed to trigger. A brand awareness video is judged first by its ability to reach and hold its audience. An acquisition ad must also lead to a visit, an add-to-basket, an enquiry or a sale.
Note down the objective, audience, platform, placement, period and budget spent. These elements form the context for comparison. If two versions were shown to different audiences or in different placements, their results cannot clearly isolate the effect of the edit or the hook.
Pair each objective with one primary metric and a few diagnostic signals. For a views campaign, track reach and watch time. For a traffic campaign, also look at click-through rate and cost per visit. For a conversion campaign, link clicks to the actions completed and their cost.
How Do You Judge the Hook and Retention?

Imagine viewers leave the video before the product or the main message appears. Replay the first few seconds and identify what is immediately visible and understandable: the subject, the promise and the context. A video hook doesn’t need a spectacular effect, but it must make what follows clear enough to make people want to stay.
Next, look at retention at the various points available in the report: initial views, average watch time and the share of viewers who continue or finish the video. A sudden drop after a specific scene is a cue to inspect that sequence. A gradual decline may instead point to a pace that is too slow, a repeated idea or a promise that takes too long to pay off.
Not all views measure the same kind of exposure. A 2023 study by FranceTV Publicité and Ipsos covering 7,638 sessions found that 35% of the social media ads studied met the MRC Cross-Video viewability standard, compared with 97% for online video. This result concerns the viewability threshold studied, not actual attention or sales. (ipsos.com)
How Do You Link Attention to Campaign Results?
A video can hold viewers without triggering the intended action. If retention is good but clicks remain low, check that the promise, the offer and the call to action are consistent. If there are plenty of clicks but few people convert, also examine the landing page and the post-click journey.
To interpret these gaps, set the video ad metrics against your campaign data: views, retention, engagement, clicks and conversions. Choose the measures suited to the objective rather than relying on a single figure. We also detail the metrics for measuring a social video to help structure this analysis.
A like, a share or a volume of views offer clues, but they do not replace measuring the intended action. Also look at cost per result and check that the conversion event being tracked genuinely matches the defined objective. Ad creative analysis becomes more useful when it pinpoints something to fix, not just a video that succeeded or underperformed.
How Do You Compare Several Versions Without Skewing the Analysis?
Suppose you are torn between two openings for the same product. Change one element at a time, for example the hook, and keep the audience, placement, offer and time period as similar as possible. You will then be better able to link the difference in results to the change being tested.
Benchmarks are no substitute for this comparison. The data published by Socialinsider for 2026 covers, among other things, millions of videos across different platforms from January to June 2026, and accounts of varying sizes. This scope provides industry context, but it does not constitute a universal threshold applicable to a specific ad, audience and objective. (socialinsider.io)
TikTok’s documentation describes a video analysis feature that lets you compare two creatives frame by frame according to the chosen metric. (ads.tiktok.com) Whatever tool you use, keep the results for each version and record the variable being tested. Our page also explains how to understand the hook rate of a video ad without confusing this signal with overall performance.
What Should You Change After the Diagnosis?
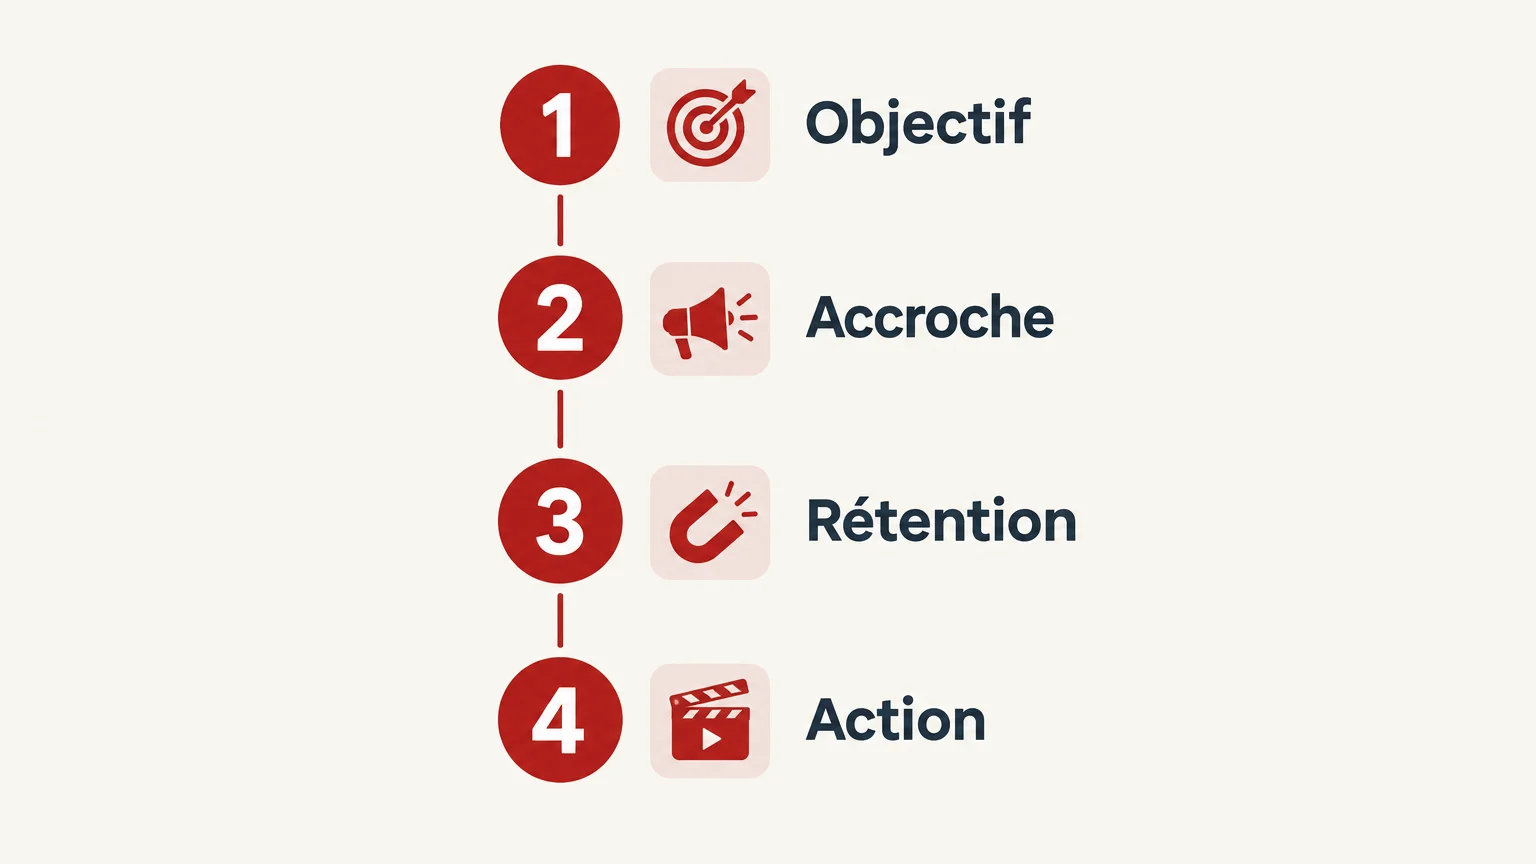
Once you have identified the breaking point, turn it into a concrete hypothesis. If viewers leave the video before the product is introduced, test a more direct opening. If retention holds but the action is missing, rework the demonstration, the offer or the call to action rather than changing every shot.
Then evaluate the new version against the same objective and under comparable delivery conditions. Record the result, the change made and the decision taken. If performance declines over time despite stable targeting, also look at exposure frequency and how reactions evolve before concluding that you are facing ad creative fatigue.
This approach follows a simple loop: observe, form an explanation, change one element and measure again. Our teams combine strategy, scripting, shooting and editing to produce ad variations, and can then link the creative work to media management and A/B testing.
Key Takeaways on Video Ad Analysis
Analysing a video ad links the campaign objective to attention signals, then to clicks or conversions. By comparing versions under similar conditions, you can tell apart a problem with the hook, retention or the intended action. Each finding should lead to a precise hypothesis and a measurable test.
From Creative to Managing Your Video Ads
When results flag something to improve, you need to be able to turn the diagnosis into a new creative and compare it under consistent conditions. We support brands from strategy through to vertical video production, with the option of combining creative work with paid media management.

We have worked with more than 350 brands and accumulated 500 million views, experience benchmarks that do not prejudge the outcome of any given campaign. Discover our creative ads solutions and talk to our team about the formats, tests and level of support suited to your objectives.
Frequently Asked Questions
Which metrics should you check first for a video ad?
Start from the objective: retention for attention, clicks for traffic, conversions for sales or enquiries. Reach and cost per result then help place these signals in the context of delivery.
How can you tell if a video’s hook is working?
Look at the first few seconds and the viewing data available at that point in the journey. If retention drops before the promise is understood, test a more direct opening while changing only one element.
Can you compare videos run on different platforms?
A direct comparison is tricky, because placements, audiences and measurement rules can differ. First compare versions within the same environment, then use external benchmarks as context only.
How long does it take to analyse a video ad?
Start by checking the objective, delivery conditions and key metrics in the campaign report. The time required depends on the number of versions, the data available and how precise a diagnosis you need.
Can creative production be combined with media management?
Yes, we can combine creative ads production with paid campaign management, including A/B testing and results tracking. Creative production can also be carried out separately from media management.