

A Reel with lots of views is not automatically more useful than a carousel that drives saves or clicks. Instagram has expanded the interaction data available for these two formats. To link these signals to a concrete objective, we also explain how to measure the performance of creative content beyond view count alone.
These changes help you spot the moments or visuals that catch attention, but they are no substitute for an overall analysis. To assess the performance of Reels and carousels, you also need to take into account reach, viewing, interactions and the intended action. The right metric therefore depends on the question each post is meant to answer.
What Has Instagram Actually Changed in Its Insights?

The most tangible new feature concerns the link between a like and the content being viewed at that moment. On 4 August 2025, Instagram unveiled a metric that shows the point at which someone likes a Reel. For a carousel, the metric shows the image displayed at the moment of the like, as described by Le Blog du Modérateur.
This like-by-moment data helps you frame a precise editorial question: which moment or which visual held the attention of the people who interacted? On a Reel, you can check whether a particular moment seems to trigger a reaction. On a carousel, you can identify the images associated with likes and compare their role in the story.
However, the signal should be interpreted for what it is. It shows the content visible at the moment of a like, not the total number of people who enjoyed each second or each slide. It is therefore neither a complete measure of retention nor proof that this image caused the interaction.
Which Metrics Should You Check in Instagram Insights?
In April 2026, the Insights screen also changed. Social Media Today reports the addition of tabs giving easier access to summaries of engagement and audience, as well as an updated layout for individual posts and Reels.
This information is best read in light of the content's objective. To broaden discovery, look at views and reach. To gauge the interest generated, examine interactions, saves and shares. To judge a video, watch time and drop-offs offer a different perspective from the number of views.
A post designed to raise awareness of an offer and an educational carousel do not necessarily share the same priority metric. The first can be assessed on views or profile visits. The second may aim for saves, shares or clicks. To put this data into the context of distribution, we also take a look at the Instagram Reels algorithm.
How Do You Interpret Interactions Without Overrating a Signal?
Imagine a Reel whose views are rising but which generates few profile visits. This combination suggests checking whether the hook is attracting the right people and whether what follows makes the offer clear enough. On its own, it does not allow you to conclude that the content has succeeded or failed.
For a carousel, compare the images associated with likes with the post's other results. An image frequently linked to likes can be a useful creative pointer, but it does not necessarily tell you whether people went through all the content. Also look at saves, shares and the actions that match your objective.
Avoid comparing a Reel and a carousel on a single raw figure. The formats do not always serve the same purpose, and view count describes neither the quality of attention nor the contribution to the final result. One primary metric per post, backed up by a few secondary metrics, makes the analysis more useful.
How Do You Compare Reels and Carousels Meaningfully?
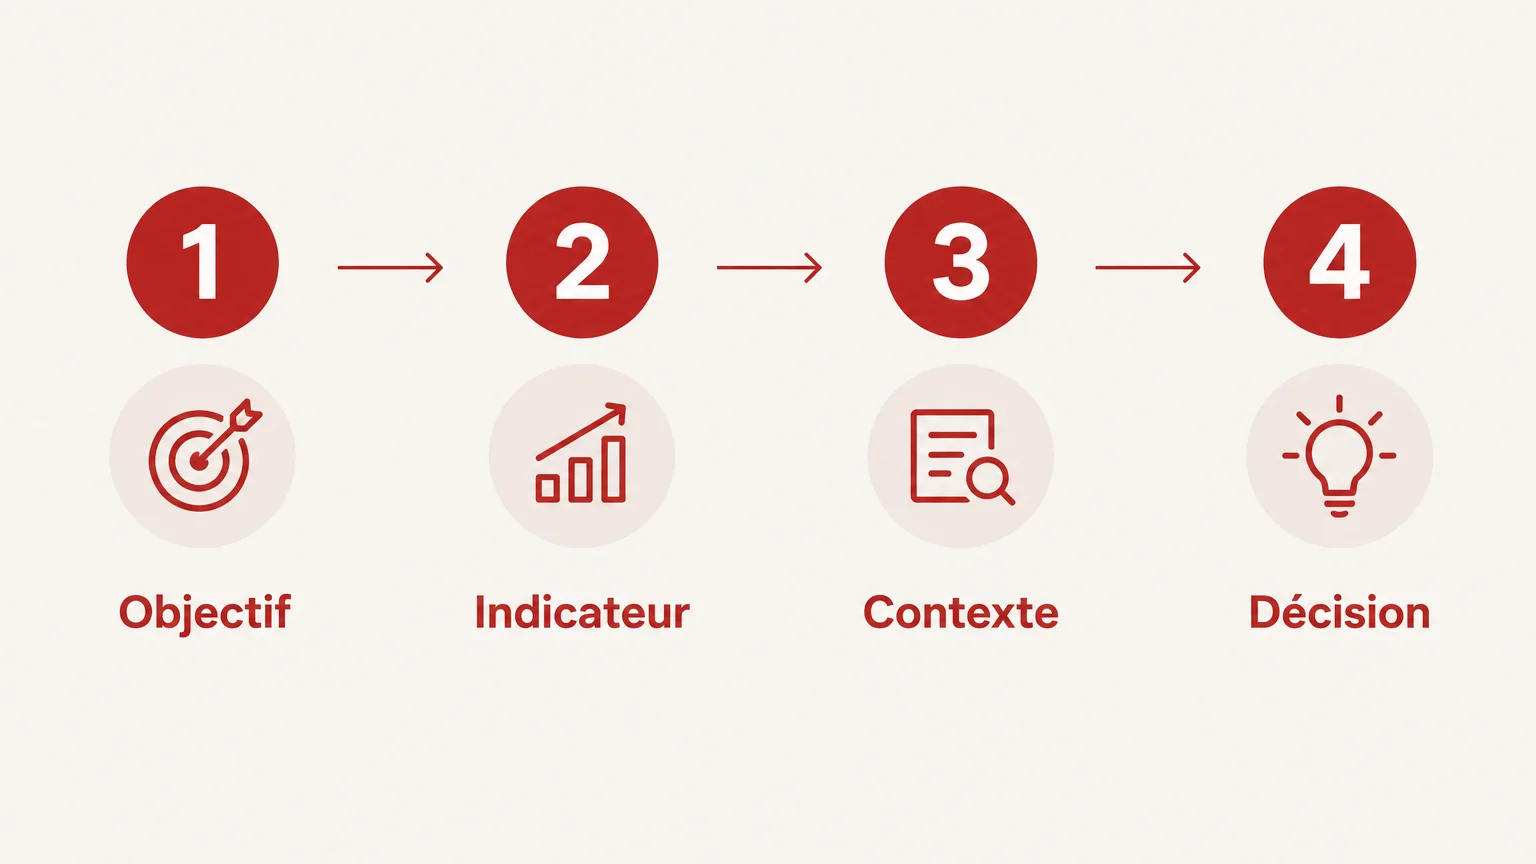
To compare two pieces of content, start by checking that they serve a similar objective and target a comparable audience. A discovery Reel and a carousel designed to explain an offer do not make for a fair test. A useful comparison instead looks at several similar posts, assessed against the same metric.
- Set the objective: visibility, engagement, visits or conversions.
- Choose the metric linked to that objective, then a few complementary measures.
- Note the context: format, topic, hook, date and target audience.
- Decide on a test: change one element at a time and observe the results.
Average watch time and total watch time are among the metrics you can examine for Reels. Meta explained how they work in an update published in 2023: total watch time includes repeat views, while average watch time divides viewing time by the number of plays. This distinction helps you avoid confusing cumulative duration with average attention.
To link results to campaign objectives, we recommend tracking views, retention, engagement, clicks or conversions as appropriate. We also explain in detail how to measure the ROI of your social media activity so you can look beyond visibility metrics alone.
What Limitations Should You Bear in Mind When Tracking?
An interaction metric is no substitute for analysing the post as a whole. The moment of a like does not reveal all the silent reactions, and a view does not necessarily mean someone watched the content to the end. Match each measure to a clear question rather than looking for a single score.
Comparisons also benefit from remaining consistent over time. Avoid setting side by side content published in very different contexts or results that do not cover the same period. Regular tracking helps you spot trends specific to your account, without turning an isolated fluctuation into a general rule.
When several people are involved in publishing and moderation, a shared method makes it easier to track community interactions. We can also support you with the keys to managing and engaging an Instagram community, linking the conversations you observe to the content you publish.
A More Precise Reading of Instagram Performance
Instagram improves tracking for Reels and carousels by linking certain likes to the moment or image concerned. Use this marker as a creative clue, then cross-reference it with views, watch time, shares, saves and the intended actions. To compare your content, keep a clear objective, a suitable metric and a context as similar as possible. That is how Instagram performance tracking becomes a decision-making tool rather than a mere record of statistics.
Turn Your Statistics into a Creative Lever
Interpreting statistics requires a method that links objectives, content and results. If you would like to structure this approach, we can support you from strategy through to production, then the analysis of the metrics suited to your posts.

We produce vertical videos for Instagram, including Reels in 9:16 format and adaptations for the feed. Depending on your needs, our support can include production, media management or social media management. To speak with our social media agency, tell us about your current formats and your measurement objectives.
Frequently Asked Questions
What does the new like metric show on a Reel?
It shows the moment in the video at which someone liked the content. It helps you spot an interesting moment, but it is no substitute for a complete measure of viewing or retention.
Does Instagram show which image was liked in a carousel?
Instagram has added a marker associating a like with the image displayed at the moment of the interaction. This signal complements the carousel's overall statistics, without measuring interest in each image on its own.
Which statistics should you track for a Reel?
Choose them according to the objective: views and reach for discovery, watch time for attention, or interactions for engagement. If the Reel is aimed at a commercial action, also track any available clicks or conversions.
How do you compare the performance of a Reel and a carousel?
Compare content that shares a similar objective and context. Analyse a primary metric suited to that objective, then examine the complementary measures without limiting yourself to views.
How can an agency help with tracking Instagram statistics?
We can link Reels strategy and production to your measurement objectives, then track views, retention, engagement, clicks or conversions depending on the project. Our support can also include media management or social media management.